Previous Page Next Page Table of contents

Modeling example

The essence of VES data processing may be shown on a flexure fold model (The central part of model is shown on fig.6). 2D modeling data for the flexure fold added with NSI were processed with the IPI-2D package, but at first example deep objects resistivities were made equal to surrounding to neglect their influence.

Fig. 6. Full model of flexure fold with NSI and deep objects

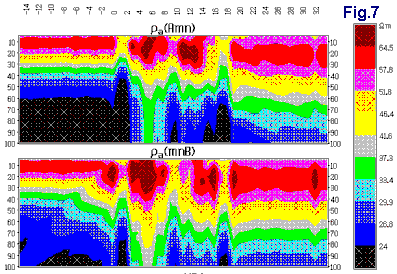
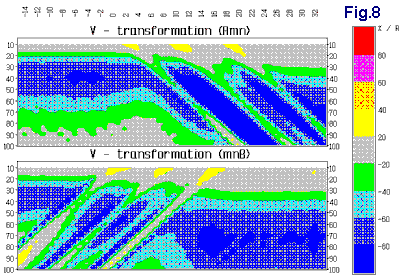
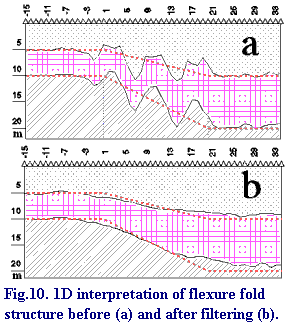
Rhoa field for AMN & MNB arrays (fig.7) is highly distorted by NSI and flexure itself. P-effect from NSI is clear visible on Rhoa cross-section, and C-effect is more clear visible in V-transformation (fig.8). After recalculation "field's" data to AMNB array and their 1D interpretation, form of boundaries will be distorted (fig.10a).

Fig.9. Comparison of apparent resistivity fields after filtering (a) and calculated without NSI (b)

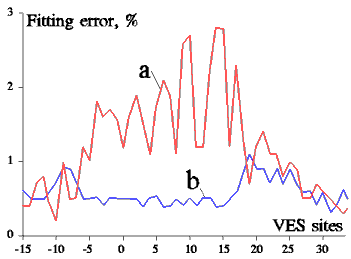
The deep boundaries look like being seen through "broken glass" - NSI. After filtering with Median program Rhoa field (fig.9, upper) looked like one, calculated for model without NSI (fig.9, lower). All details connected with deep objects been unchangeable. After filtering 1D interpretation gives the structure boundaries much more correctly (fig.10b). Additional estimate of the filtering quality may be fitting error between VES "field's" and theoretical curves (fig.11). These errors are reduced noticeable after filtering, especially in the part of the profile with NSI (VES 0-20). The smaller is fitting error the more narrow are equivalence principle boundaries.

Fig.11. VES interpretation fitting errors before (a) and after (b) filtering

119899, Russia, Moscow, Moscow State University, Geological Faculty, Department of Geophysics
V.A. Shevnin,I.N. Modin
Tel. & fax: (7095) 939 49 63
E-mail: sh@geophys.geol.msu.ru

Please feel free to send us your comments.

Previous Page Next Page Table of contents